

Chart of the Week - Monetary Policy in 2022
Chart of the Week - Monetary Policy in 2022
This week: Global Equity Sectors, Gold tactical outlook, global monetary policy map, shadow rates, equity risk premium, TIPS breakevens, Gold valuation indicator...

This email gives you a brief overview of what was covered in the latest Weekly Insights report including of course, the Chart Of The Week.
Check out the full archives of the Chart Of The Week for more charts.
Chart of the Week - Death By 386 Rate Hikes
Monetary Policy in 2022: Monetary policy tightening was the big macro theme of 2022, and it is sure to echo at least for a time into 2023. The 2022 full-year count on my numbers came in at 386 rate hikes across 82 central banks (which compares to 123 rate hikes across 41 central banks in 2021).
The pace, magnitude, and breadth of rate hikes globally is unprecedented in recent years, and the impact of this is going to be felt increasingly this year (especially more-so for the economy, as markets have mostly reacted already to the policy tightening so far e.g. both stocks and bonds falling double-digits last year).
So a very interesting and important chart both in terms of putting last year into context, and in terms of what’s going to matter in macro this year.
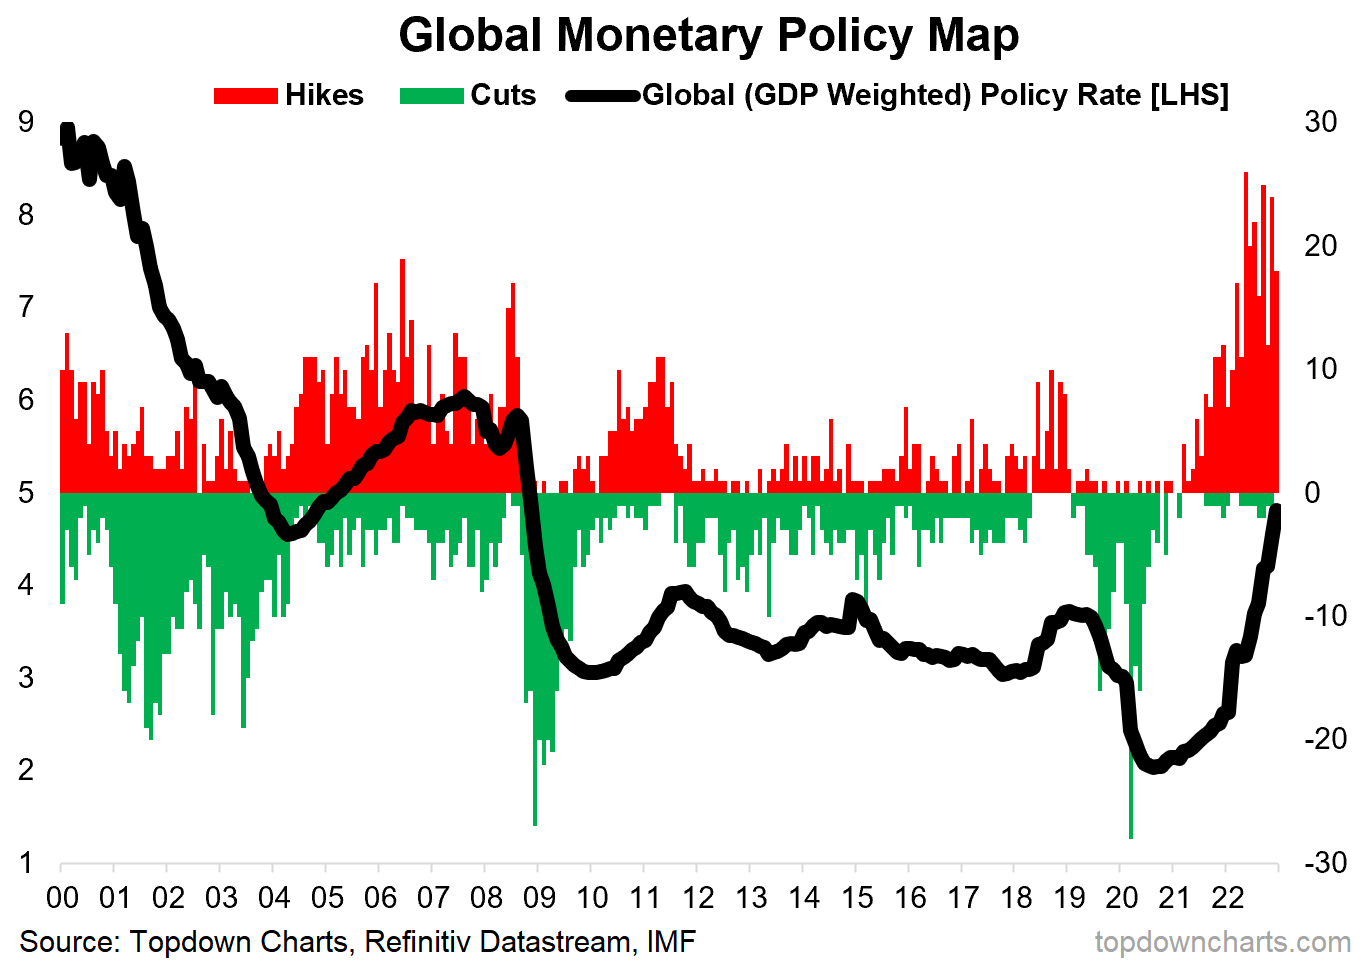
Key point: 2022 saw a record pace, magnitude, and breadth of rate hikes globally.
Thanks to this week’s sponsor: Stratosphere.io
New Stock Research Platform Makes Fundamental Research Easier
Gathering KPIs and segment data is a time sink for investors.
Stratosphere.io makes the process easy, clean, and clear with their brand new platform and you can give it a try completely for free.
It gives you the ability to:
Quickly navigate through the company’s financials on their beautiful interface
See every metric visually
Go back up to 35 years on 40,000 stocks globally (!)
Compare and contrast different businesses and their KPIs
Build your own custom views for tracking your portfolio
Stratosphere.io has just relaunched their platform, so go give it a try now for free!
Topics covered in the latest Weekly Insights Report
Aside from the chart above, we looked at several other charts, and took a bite out of some really important macro/asset allocation issues right now:
Global Equity Sectors: significant technical moves in Financials and Tech.
Gold Price: a decisively bullish turn in the tactical outlook.
Shadow Policy Rates: a 600bp rise meant dark times for markets.
Equity Risk Premium: the US still looks expensive on an ERP basis.
TIPS Breakevens: see further downside, prefer nominal bonds.
Gold Valuation Indicator: you could argue gold is cheap.
Subscribe now to get instant access to the report so you can check out the details around these themes, as well as gaining access to the full archive of reports.
For more details on the service check out this recent post which highlights: What you get with the service; Performance of the service (results of specific ideas and TAA); and importantly: What our clients say about it…
But if you have any other questions on our services definitely get in touch.
Thanks for your interest. Feedback and thoughts welcome.
Sincerely,
Callum Thomas
Head of Research and Founder at Topdown Charts
Follow me on Twitter
Connect on LinkedIn