

Chart of the Week - Big Value in Small Caps
Chart of the Week - Big Value in Small Caps
A look at valuations for the smallest vs the largest stocks in the USA...

Chart of the Week - Big Value in Small Caps
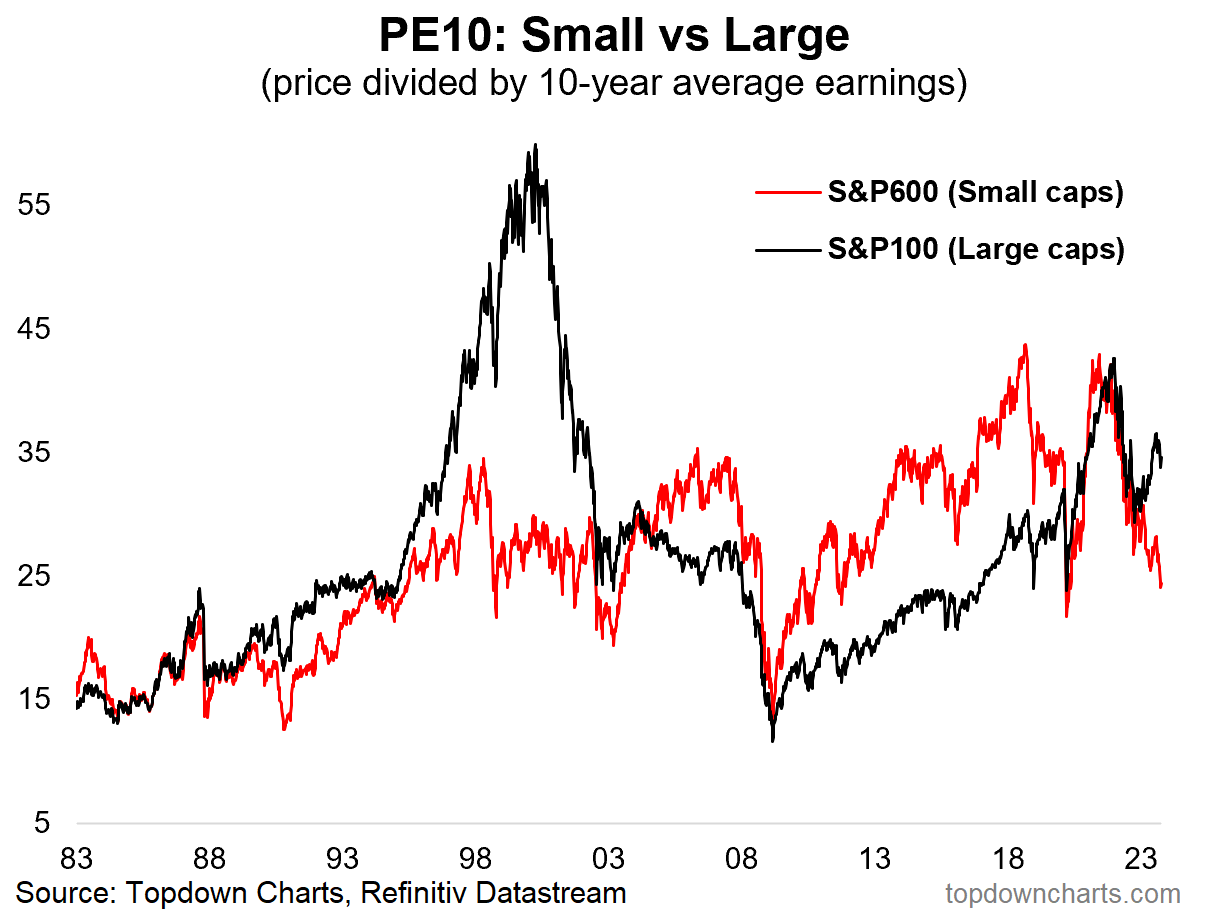
Valuations: With US small cap equities sitting at about 0% YTD so far in 2023 (and occupying a tight trading range for much of the past 18-months), they may not stand out as particularly interesting. Especially in the context of tech stocks still sitting around +40% YTD.
But the chart below presents an interesting picture that some might have missed. The S&P600 index PE10 ratio (price vs 10-year average trailing earnings) has dropped well below the 2016/18 lows and is currently sitting about 10% below long-term average. It’s also tracking some 30% below the same metric for large caps (S&P100), and now down 45% off its 2021 high. So a major valuation adjustment has ocurred.
It is worth acknowledging that the indicator has not gotten quite as low as it traded in the depths of 2003/2009/2020, but at this point the market is pricing in a much dimmer outlook for small caps vs recent years and vs large caps.
And to be fair there are notable downside risks; for instance rising corporate bond yields + credit tightening (which smaller companies tend to be more exposed to), and of course the regional bank issues earlier this year (financials make up a large weighting within small caps). Small Caps generally also have greater exposure to traditional cyclicals (while much smaller exposure to tech).
But at a certain point, all of this becomes reflected in the price — and if valuation more than accounts for these factors, and if the investor timeframe is long-enough, then value opportunities arise.
Key point: US Small Cap stocks are cheap vs history and vs large caps.
n.b. Check out the full archives of the Chart Of The Week for more charts.
Aside from the Chart Of The Week, this email gives you a brief overview of what was covered in our latest Weekly Insights Report (this email provides a free preview of the Topdown Charts premium service on Substack).
Topics covered in the latest Weekly Insights Report
Aside from the chart above, we looked at a bunch of other charts across some important and interesting macro/asset allocation issues:
Cross-Asset Market Update: equities, fixed income, currencies, commodities
Risk-Asset Technicals: outlook for global equities, emerging markets
Macro/Market Radar: key events this week, what to watch out for
Subscribe now to get instant access to the report so you can check out the details around these themes, as well as gaining access to the full archive of reports.
For more details on the service check out this recent post which highlights:
a. What you Get with the service;
b. the Performance of the service (results of ideas and TAA); and
c. What our Clients say about it.
Thanks for your interest. Feedback and thoughts welcome.
Sincerely,
Callum Thomas
Head of Research and Founder at Topdown Charts
Follow me on Twitter
Connect on LinkedIn