

Chart of the Week - Are Stocks Cheap Yet?
Chart of the Week - Are Stocks Cheap Yet?
This week: Gold & Silver, Global Equities, Global inflation trends, property price outlook, housing market risks, global earnings indicator, global equity valuations...

This email gives you a look at what was in the latest Weekly Insights report
Check out the full archives of the Chart Of The Week for more charts.
Chart of the Week - Global Equity Valuations
Global Equity Valuations: I still find this chart fascinating, it shows US PE10 valuations hovering around what was previously the top end of the range (of the 2017-2020 period), and still more or less double that of their global peers.
In that respect, I see this as a key reason for skepticism on the bull case for (US) equities given the still significant and growing monetary headwinds and looming recession prospects.
Other than the US, Emerging Markets have come down slightly, but likewise their PE10 ratio as a group has not yet made a cathartic plunge as for example that it and the rest of them did in 2020 (n.b. for a worked example see my “Global Equities: Generational Buying Opportunity Emerging“ post from March 2020).
Developed markets on the other hand have made a major reset, and at the low point were more or less on par with some of the other previous major market bottoms. So aside from the overall equity view, the chart is also interesting in establishing a relative value view and setting the directional bias there.
Overall though, as noted in the monthly: I’m still erring on the defensive in the asset allocation frameworks (prefer bonds in particular), and on equities prefer global ex-US vs US. But I would say it’s worth noting how different a situation it is now going into 2023 vs where things were sitting in late 2021 or even earlier this year...
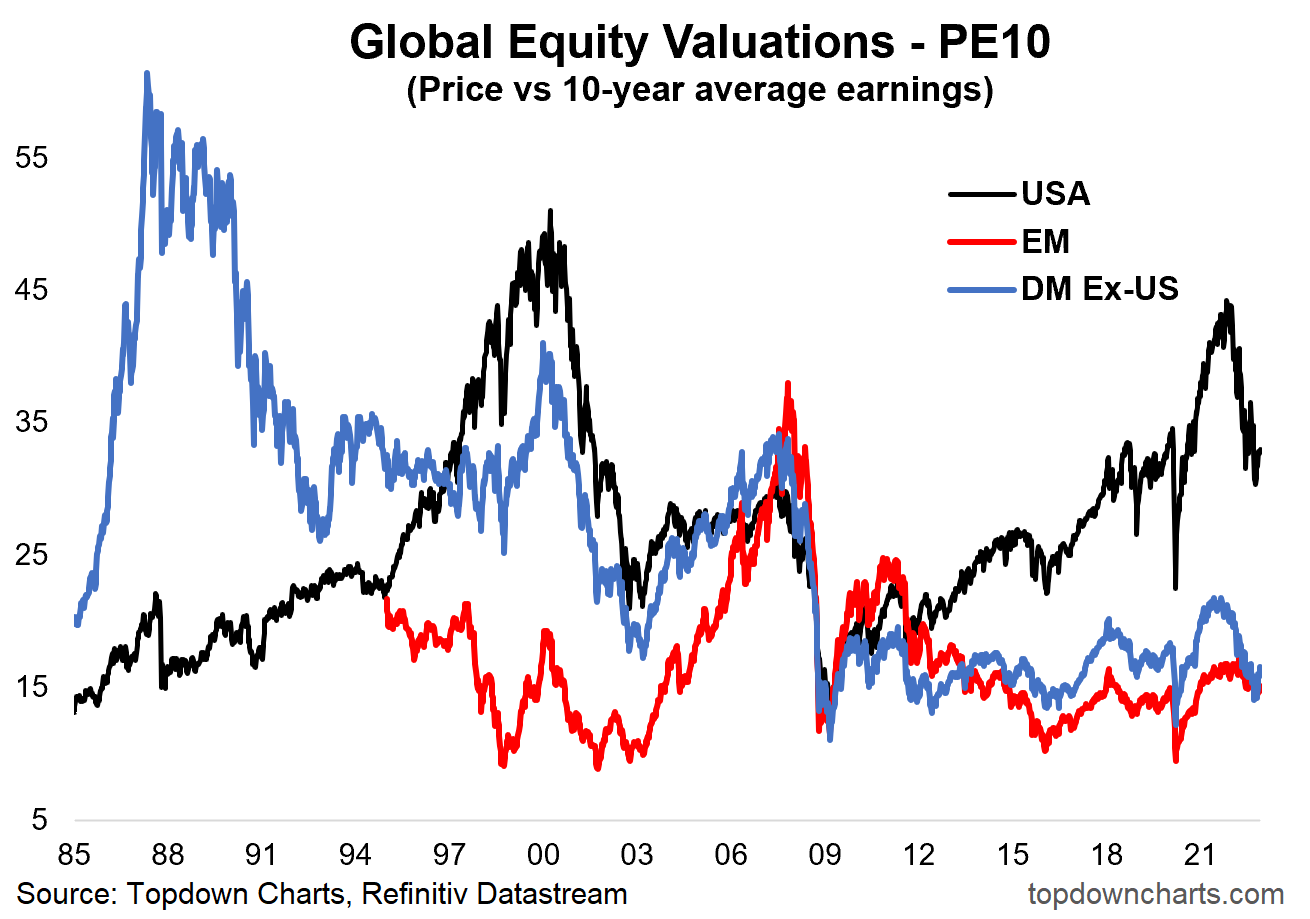
Key point: US equities are not cheap, but developed ex-US are.
Thanks to this week’s sponsor: Stratosphere.io
Take your Stock Research into the Stratosphere with this NEW tool!
Gathering KPIs and segment data is a time sink for investors.
Stratosphere.io makes the process easy, clean, and clear with their brand new platform and you can give it a try completely for free.
It gives you the ability to:
Quickly navigate through the company’s financials on their beautiful interface
See every metric visually
Go back up to 35 years on 40,000 stocks globally (!)
Compare and contrast different businesses and their KPIs
Build your own custom views for tracking your portfolio
Stratosphere.io has just relaunched their platform, so go give it a try now for free!
Topics covered in the latest Weekly Insights Report
Aside from the chart above, we looked at several other charts and intriguing macro/asset allocation issues as the year closes out:
Gold & Silver: precious metal prices breaking out.
Global Equities: mixed signals, with cautionaries and cause for optimism.
Global Inflation Trends: a very different picture headed into 2023 vs 2022.
Property Price Inflation: property price inflation trends reinforcing CPI trends.
Housing Market Valuations: problems for property.
Global Earnings Outlook: an interesting and unique indicator is on the move.
Valuations: update on global equity valuations.
Subscribe now to get instant access to the report so you can check out the details around these themes, as well as gaining access to the full archive of reports.
For more details on the service check out this recent post which highlights: What you get with the service; Performance of the service (results of specific ideas and TAA); and importantly: What our clients say about it…
But if you have any other questions on our services definitely get in touch.
Thanks for your interest. Feedback and thoughts welcome.
Sincerely,
Callum Thomas
Head of Research and Founder at Topdown Charts
Follow me on Twitter
Connect on LinkedIn