

Chart of the Week and Weekly Report Highlights
Chart of the Week and Weekly Report Highlights
This week: Global Property Prices, Defensive Value stocks, Gold price outlook, Gold Miners, Silver, Sovereign Bond Yields, US Equity (de)Leverage, Treasuries.

This email gives you a look at what was in the latest Weekly Insights report
The Weekly Insights Report is part of our entry-level service: summarizing the key points, ideas and charts from our institutional research service.
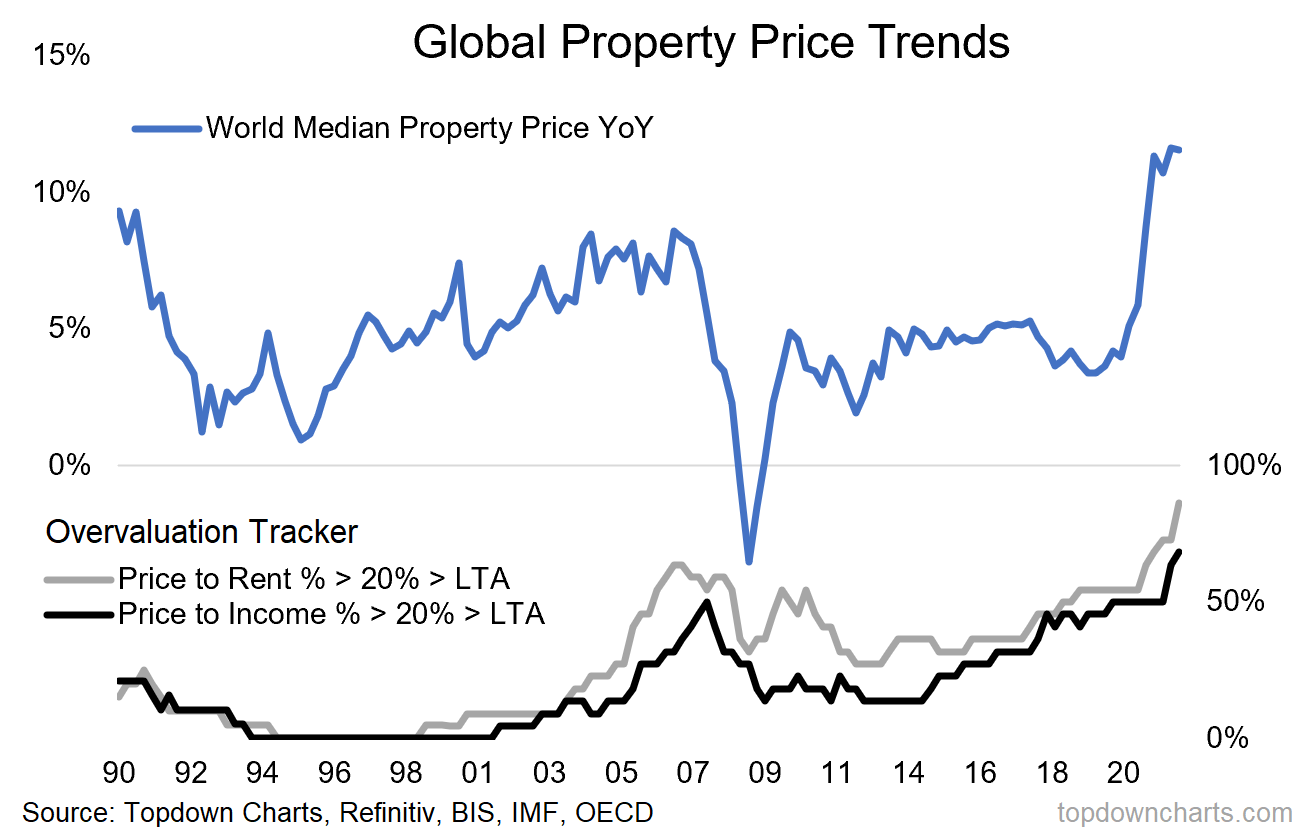
Chart of the Week - Global Property Price Boom (and?)
Pandemic Property Price Pop: Globally property prices have been juiced to historically expensive levels thanks to pandemic (over)stimulus. As an indication of just how quickly prices have risen, the world median property price growth rate has increased more than 10% year over year. That is the fastest pace of increase in more than 3 decades, and nearly double the average increase over the last 10 years.
While there are some countries and regions that are a bit more egregious than others, this is actually a relatively widespread issue. For instance, the “Overvaluation Tracker”” shows 90% of countries’ housing markets are at least 20% more expensive than usual on a price-to-rent ratio basis, and 70% of countries see house price-to-income ratios at least 20% overvalued.
And of particular interest: looking at both valuation metrics, globally house prices are more expensive than the pre-financial crisis peak.
Given the looming macro headwinds to housing (rising interest rates as central banks lurch into tightening, squeeze on discretionary incomes from rising costs, and global recession risk) this presents a clear vulnerability, and risk of a housing bust.
Key point: The economic cure of the pandemic has left extreme side-effects.
Check out the latest Weekly S&P500 ChartStorm!
Our founder and Head of Research, Callum Thomas, puts out a [FREE] weekly round-up of charts on the S&P500 (US equities); and the various forces and factors that influence the outlook - with the aim of bringing insight and perspective.
Head over and subscribe to the ChartStorm Substack and be sure to follow on Twitter too to participate in the weekly Stock & Bond Surveys.
Topics covered in the latest Weekly Insights Report
Aside from the chart above (along with the implications of the souring global property price outlook for stocks and bonds), we looked at several other charts, and dug into a few key macro/asset allocation issues:
Global Property Prices: risks and opportunities stemming from the outlook.
Defensive Value: review of valuations after such a strong run.
Gold: weighing up the good, bad, and ugly for the gold price outlook.
Gold Miners: checking the tenuous technicals, macro, and valuations.
Silver: a look at the contrarian case, but also the macro/momentum case.
Sovereign Bond Yields: where-to next for global bond yields.
US Equity Leverage: charts show some progress on deleveraging…
Treasuries: key tactical insights for treasuries (and recommendation).
Subscribe now to get instant access to the report so you can check out the details around these themes, as well as gaining access to the full archive of reports.
If you have any Questions/Doubts about Subscribing check out this recent post which highlights: What you get with the service; Performance of the service (results of specific ideas and TAA); and importantly: What our clients say about it…
Thanks for your interest. Feedback and thoughts always welcome.
Sincerely,
Callum Thomas
Head of Research and Founder at Topdown Charts
Follow me on Twitter
Connect on LinkedIn