

Chart of the Week and Weekly Report Highlights
Chart of the Week and Weekly Report Highlights
This week: PMI Pulse/Recession Watch, Stocks vs Bonds, EMFX, US Equity Flows & Sentiment, Gold outlook, USD, Global Equity Sectors, EM equities.

This email gives you a look at what was in the latest Weekly Insights report
The Weekly Insights Report is part of our entry-level service: summarizing the key points, ideas and charts from our institutional research service.
Chart of the Week - Technical Patience in EM Equities
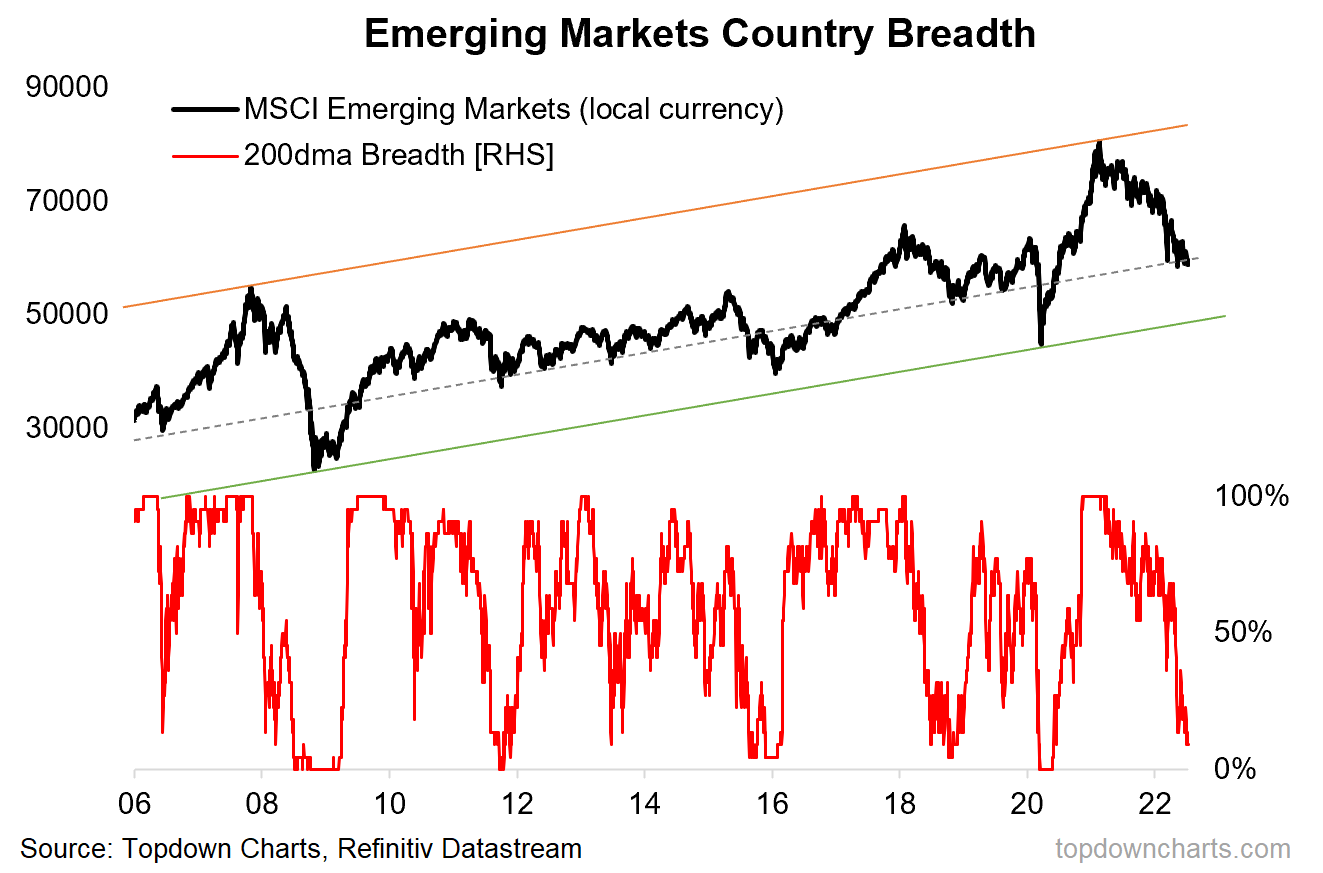
Emerging Market Equity Technicals: Today we’re focusing on the local currency version of the MSCI EM index, so that we can see what is going on in the underlying equity market independent of the action in EMFX (which has itself been very weak vs the US dollar recently). Looking at this version of the index helps us see the true picture of technical strength/weakness.
Along with that I’ve included the 200-day moving average breadth indicator, using local currency indexes for each of the countries that make up the index. Again this is so that we can peer through and detect emerging signs of strength/weakness beyond the headline index.
The key standout in this chart is the index dropping to that lower uptrend line within its longer-term up-trend channel. This has been a key zone for the index to find support in recent years, but it also serves as a risk trigger in that a breach of that line will open up the prospect of further downside.
Meanwhile, the breadth indicator is showing widespread weakness across emerging markets, which along with macro headwinds and the downdrafts in EMFX could well tip the odds in favor of a further push to the downside in the headline index.
While the breadth indicator is close to levels most would consider “oversold”, a more powerful signal would be if it dropped to zero and then turned back up. So while this chart carries some cause for optimism (we are clearly well progressed in the EM bear market), the main message remains one of caution and patience.
Specifically, I will be looking for improved technicals (not yet), more compelling valuations (not yet), more fulsome washout in sentiment (not quite), and a shift in the macro currents (also not yet). So be sure to follow for updates on all of this!
Key point: EM equity technicals suggest caution and patience for now.
Please feel welcome to share the Chart of the Week!
I would greatly appreciate it if you can help spread the word ↓
The easiest way to help do that is to simply forward this email to your friends, or you can just share the chart/link on social media (be sure to mention us! :-).
Topics covered in the latest Weekly Insights Report
Aside from the chart above, we looked at several other charts, and took a bite out of some very interesting macro/asset allocation issues right now:
PMI Pulse/Recession Watch: update on recession vs inflation outlook.
Stocks vs Bonds: review of the key drivers for stocks vs bonds.
EMFX: concerning signals for EMFX, despite compelling valuations.
US Equity Flows & Sentiment: equity flows/positioning capitulating?
Gold: review of the tactical indicators for gold at this key juncture.
US Dollar: DXY breaking out, fresh lows in key USD pairs.
Global Equity Sectors: Materials and Healthcare sectors on the move.
Subscribe now to get instant access to the report so you can check out the details around these themes, as well as gaining access to the full archive of reports.
For more details on the service check out this recent post which highlights: What you get with the service; Performance of the service (results of specific ideas and TAA); and importantly: What our clients are saying about it…
But if you have any other questions on our services definitely get in touch.
Thanks for your interest. Feedback and thoughts welcome.
Sincerely,
Callum Thomas
Head of Research and Founder at Topdown Charts
Follow me on Twitter
Connect on LinkedIn